To illustrate the use of curve_fit in weighted and unweighted least squares fitting, the following program fits the Lorentzian line shape function centered at \(x_0\) with halfwidth at half-maximum (HWHM), $\gamma$, amplitude, $A$:
\begin{equation} $f(x) = \frac{A \gamma^2}{\gamma^2 + (x-x_0)^2},$ \end{equation}
to some artificial noisy data. The fit parameters are $A, \gamma$ and $x_0$. The noise is such that a region of the data close to the line centre is much noisier than the rest.
import numpy as np
from scipy.optimize import curve_fit
import pylab

x0, A, gamma = 12, 3, 5

n = 200
x = np.linspace(1, 20, n)
yexact = A * gamma**2 / (gamma**2 + (x-x0)**2)

# Add some noise with a sigma of 0.5 apart from a particularly noisy region
# near x0 where sigma is 3
sigma = np.ones(n)*0.5
sigma[np.abs(x-x0+1)<1] = 3
noise = np.random.randn(n) * sigma
y = yexact + noise

def f(x, x0, A, gamma):
    """ The Lorentzian entered at x0 with amplitude A and HWHM gamma. """
    return A *gamma**2 / (gamma**2 + (x-x0)**2)

def rms(y, yfit):
    return np.sqrt(np.sum((y-yfit)**2))

# Unweighted fit
p0 = 10, 4, 2
popt, pcov = curve_fit(f, x, y, p0)
yfit = f(x, *popt)
print('Unweighted fit parameters:', popt)
print('Covariance matrix:'); print(pcov)
print('rms error in fit:', rms(yexact, yfit))
print()

# Weighted fit
popt2, pcov2 = curve_fit(f, x, y, p0, sigma=sigma, absolute_sigma=True)
yfit2 = f(x, *popt2)
print('Weighted fit parameters:', popt2)
print('Covariance matrix:'); print(pcov2)
print('rms error in fit:', rms(yexact, yfit2))

pylab.plot(x, yexact, label='Exact')
pylab.plot(x, y, 'o', label='Noisy data')
pylab.plot(x, yfit, label='Unweighted fit')
pylab.plot(x, yfit2, label='Weighted fit')
pylab.ylim(-1,4)
pylab.legend(loc='lower center')
pylab.show()
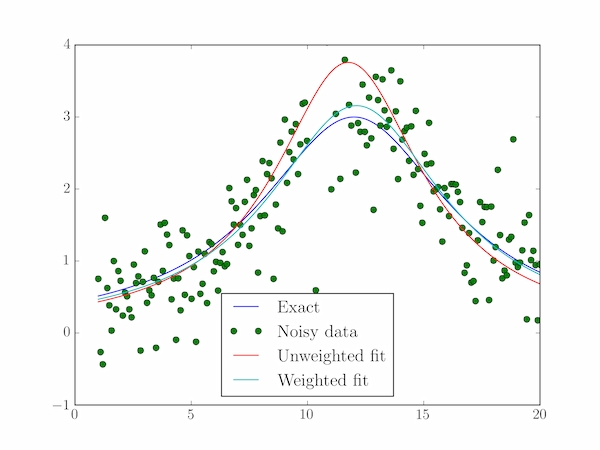
As the figure above shows, the unweighted fit is seen to be thrown off by the noisy region. Data in this region are given a lower weight in the weighted fit and so the parameters are closer to their true values and the fit better. The output is:
Unweighted fit parameters: [ 11.61282984   3.64158981   3.93175714]
Covariance matrix:
[[ 0.0686249  -0.00063262  0.00231442]
 [-0.00063262  0.06031262 -0.07116127]
 [ 0.00231442 -0.07116127  0.16527925]]
rms error in fit: 4.10434012348

Weighted fit parameters: [ 11.90782988   3.0154818    4.7861561 ]
Covariance matrix:
[[ 0.01893474 -0.00333361  0.00639714]
 [-0.00333361  0.01233797 -0.02183039]
 [ 0.00639714 -0.02183039  0.06062533]]
rms error in fit: 0.694013741786
copyright or refer to : https://scipython.com/book/chapter-8-scipy/examples/weighted-and-non-weighted-least-squares-fitting/